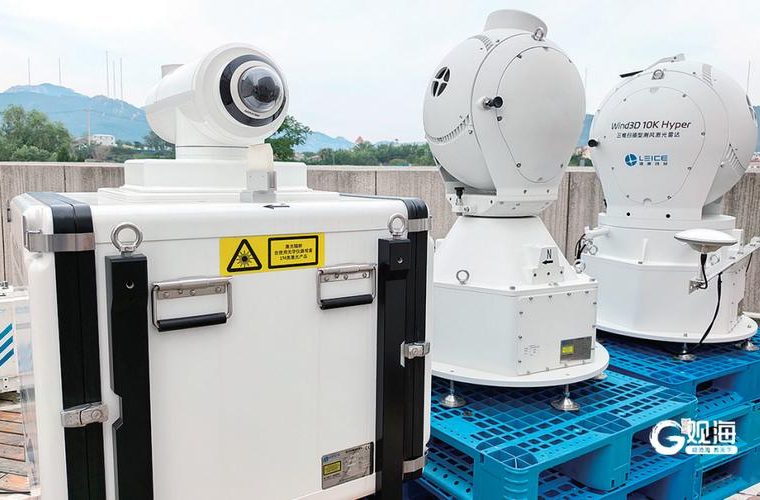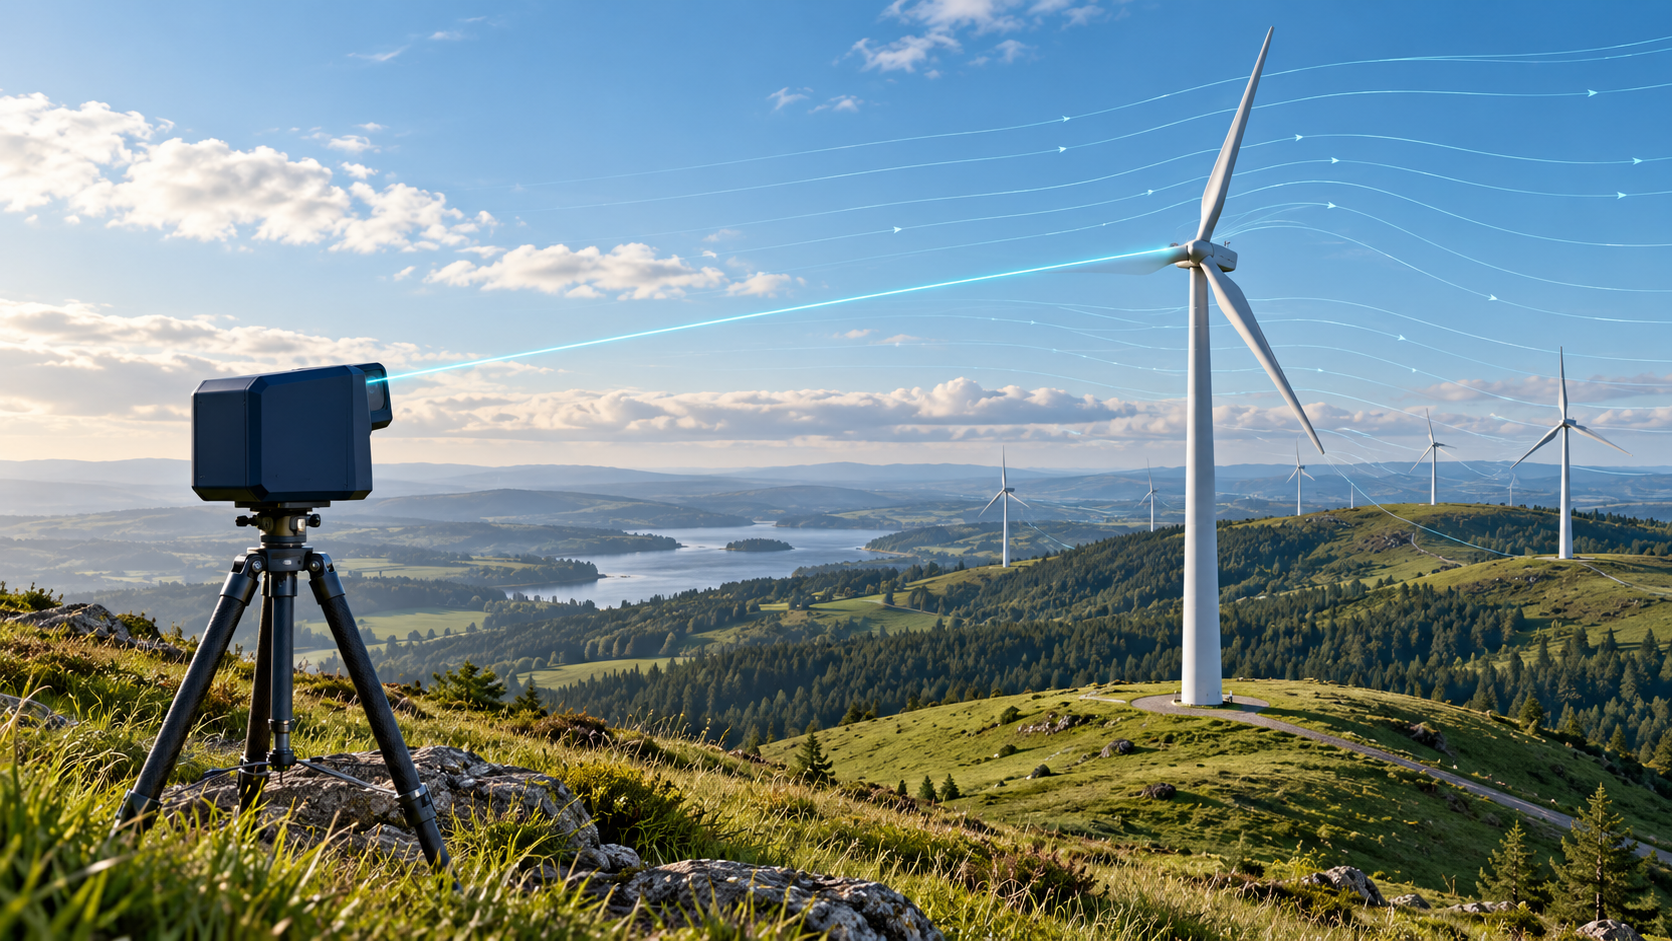
Wind LiDAR is useful when a project needs wind measurements above a mast, ahead of a turbine rotor, or across a wider section of a wind farm. The instrument sends laser light into the atmosphere and analyses light scattered back by naturally occurring aerosols. The frequency shift in that return carries information about motion along the beam. A scan pattern combines several line-of-sight measurements into a wind vector or profile.
That description sounds simple. The measurement volume, scan geometry, site conditions and data-quality rules determine what the numbers can support. This guide explains where different wind LiDAR configurations fit and what to ask before specifying one.
How a wind LiDAR measures wind
A coherent Doppler LiDAR compares the frequency of returned laser light with the transmitted signal. Aerosols moving with the air scatter a small portion of the light; their motion creates a Doppler shift. One beam gives radial velocity along its line of sight, rather than the full horizontal wind vector.
To estimate wind speed and direction, the instrument points the beam in several directions. A vertical profiling unit may use a repeating scan pattern such as VAD or DBS. The processor combines the radial measurements under assumptions about how wind varies across the sampled volume. A scanning LiDAR can instead steer its beam through selected azimuth and elevation angles to map flow in a larger area.
Many pulsed systems use the return time to associate backscatter with distance. The IEA Wind recommended practice describes this alongside the different measurement geometry used by continuous-wave systems. In either case, a reported “height” represents a sampled volume, not a point sensor sitting at that exact location.
Three jobs, three measurement layouts
Wind profiles for site assessment
A ground-based vertical profiler measures at a sequence of heights from one location. Developers use these profiles to examine wind shear, direction changes with height and conditions around the intended rotor layer. This can help with screening or supplement a measurement campaign, especially where a conventional mast would be difficult to install.
For this job, check the minimum and maximum measurement heights, number and spacing of range gates, sampling and averaging intervals, data availability, and the project’s verification requirements. Compare the LiDAR with a suitable reference instrument when the assessment method calls for it. IEA Wind’s guidance specifically addresses characterization, site selection, data handling and verification against reference measurements.
Wind ahead of a turbine
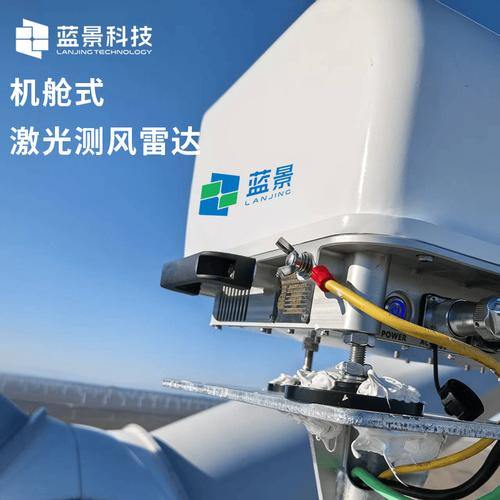
A nacelle-mounted LiDAR looks forward from the turbine and samples the approaching flow before it reaches the rotor. When connected to a compatible turbine controller, the measurements can support feed-forward control strategies. That integration depends on the turbine platform, control interface, scan geometry and how the signal is filtered and used. A sensor alone does not guarantee a reduction in loads or an increase in energy yield.
Buyers should ask for the usable look-ahead distance, number and position of beams, update rate, wind-direction performance, data interface and the turbine-control integration plan. The relevant question is whether the unit measures the flow that the controller needs, with enough lead time for that turbine and operating envelope.
Wind fields, wakes and complex terrain
A scanning system can sample multiple directions or vertical planes to investigate flow around terrain, turbines or offshore sites. Depending on the instrument and scan configuration, modes such as plan-position or range-height scans can reveal spatial patterns that a single vertical profile would miss. The extra coverage comes with more setup and analysis: scan strategy, range, spatial resolution and averaging time affect what can be inferred.
Use the scan output to answer a defined question, such as where a wake sits or how wind direction changes across a ridge. A colorful wind-field plot is not a substitute for a documented scan plan and quality checks.
Where measurements can mislead
Wind LiDAR samples a volume of air, while a cup anemometer measures wind at a point. In complex terrain, flow can curve, converge or recirculate across the sampled volume. That spatial variability can affect the retrieved wind vector and make a direct comparison with a mast harder. IEA Wind recommends considering flow heterogeneity before deployment and recording it in the site report.
Backscatter also depends on atmospheric aerosols. Low aerosol counts, precipitation, fog, cloud, background light and other conditions can affect data availability or quality; the operating limits vary by system. Ask the manufacturer which quality flags are reported, how invalid data are handled, and what environmental conditions can degrade performance.
For resource assessment or power-curve work, agree in advance on the measurement heights, scan pattern, averaging interval, reference instruments, data filters and acceptance criteria. Keep the raw or sufficiently detailed quality data where possible. A high nominal accuracy in a product table does not answer whether the complete measurement campaign meets the project’s method.
A practical specification checklist
- Start with the decision. Is the task resource characterization, turbine control, power-curve work, wake analysis, offshore assessment or general meteorology?
- Define the volume. Specify measurement height or range, gate count, range resolution, beam layout, scan pattern and the region that must be observed.
- Set the time scale. Confirm raw sampling, update rate, averaging intervals, scan revisit time, timestamp convention and required data availability.
- Plan verification. Identify the reference instrument, co-location, duration, site-flow conditions, acceptance method and responsibility for data review.
- Check operations. Confirm mounting, alignment, power, communications, remote access, storage, environmental protection, maintenance and safety documentation.
- Check integration early. For nacelle systems, confirm turbine compatibility and controller interfaces before procurement. For scanning campaigns, agree the scan schedule and output format with the analyst.
Optishine wind LiDAR options
These product families serve different measurement layouts. Their published specifications describe the listed configurations; confirm the exact variant, interfaces, environmental requirements and verification plan for the project before ordering.
- Vertical profile campaigns: Tower Wind LiDAR – HD4-400 is listed for configurable measurements across 30–400 m and up to 30 height gates. It is the closest fit in this group for teams comparing a ground-based profile with site or turbine requirements. Confirm the required measurement heights, temporal settings and project verification criteria.
- Turbine-mounted forward measurement: Nacelle Wind LiDAR – HJ4-400 is listed for measurements 50–400 m ahead of the rotor, with up to 30 configurable range gates. It is intended for turbine applications such as feed-forward control. Confirm the turbine interface and controller integration for the exact machine.
- Spatial scanning: 3D Scanning Wind LiDAR – H3D Series is a configurable 3D scanning family with DBS, RHI and PPI scan modes among its listed options. Consider it when the study needs spatial flow or wake observations beyond a single vertical profile. Agree on range, scan strategy and analysis outputs for the deployment.
Send the application, site layout, measurement region, required time resolution, installation constraints and data-interface needs with an RFQ. Those details make it possible to review a configuration against the measurement objective.
References
- IEA Wind, Recommended Practice 15: Ground-Based Vertically-Profiling Remote Sensing for Wind Resource Assessment
- U.S. Department of Energy, Wind Resource Assessment and Characterization
For a measurement-system review, send Optishine an RFQ with the project details and the team can help check product fit.